Unleashing a Data Management Revolution: UST Empowers Unprecedented Insights and Efficiency with Graph Bases for Big Data Work
In today’s data-driven world, companies face the enormous challenge of extracting valuable information from massive amounts of data to make informed decisions and gain a competitive advantage. As pioneers of big data, our company relies on a powerful tool: the graph database. This cutting-edge technology allows us to efficiently analyze terabytes and petabytes of information, revolutionizing how we process and understand complex data.
So what are graph bases?!
Graph bases are data structures that represent relationships between entities using nodes and edges. Nodes represent entities such as people, products, or events, while edges denote the connections or relationships between these entities. The power of graph bases lies in their ability to capture and analyze complex networks, making them ideal for a wide range of applications, including social networks, recommendation systems, supply chains, and fraud detection.
Graph bases offer several compelling reasons for their utilization in various domains:
Relationship-centric analysis:
Our approach’s heart lies in relationship-centric analysis, where graph databases excel. These databases capture and dissect intricate connections between entities, allowing us to comprehensively view the data’s interconnections. By mapping out relationships, we can uncover patterns, identify similarities, and comprehend the interdependencies between elements with remarkable precision.
Personalized insights:
Businesses can deliver highly accurate and personalized customer recommendations by leveraging graph bases. Graph algorithms help identify similar users or products, leading to more relevant and engaging experiences that drive customer satisfaction and loyalty.
Detecting patterns and anomalies:
Graph bases enable the detection of patterns, trends, and anomalies within interconnected data. By exploring the connections and relationships between entities, valuable insights can be derived, allowing for proactive decision-making, fraud detection, risk mitigation, and more.
Efficient data traversal:
Graph bases efficiently traverse interconnected data, allowing quick access to relevant information. With graph algorithms, complex queries can be executed efficiently, enabling rapid data analysis and reducing computational overhead.
Real-time analysis:
Graph bases are well-suited for real-time analysis and dynamic data environments. As new data is added or updated, the graph can be easily updated and analyzed in real-time, facilitating timely decision-making and ensuring the most up-to-date insights.
Scalability and performance:
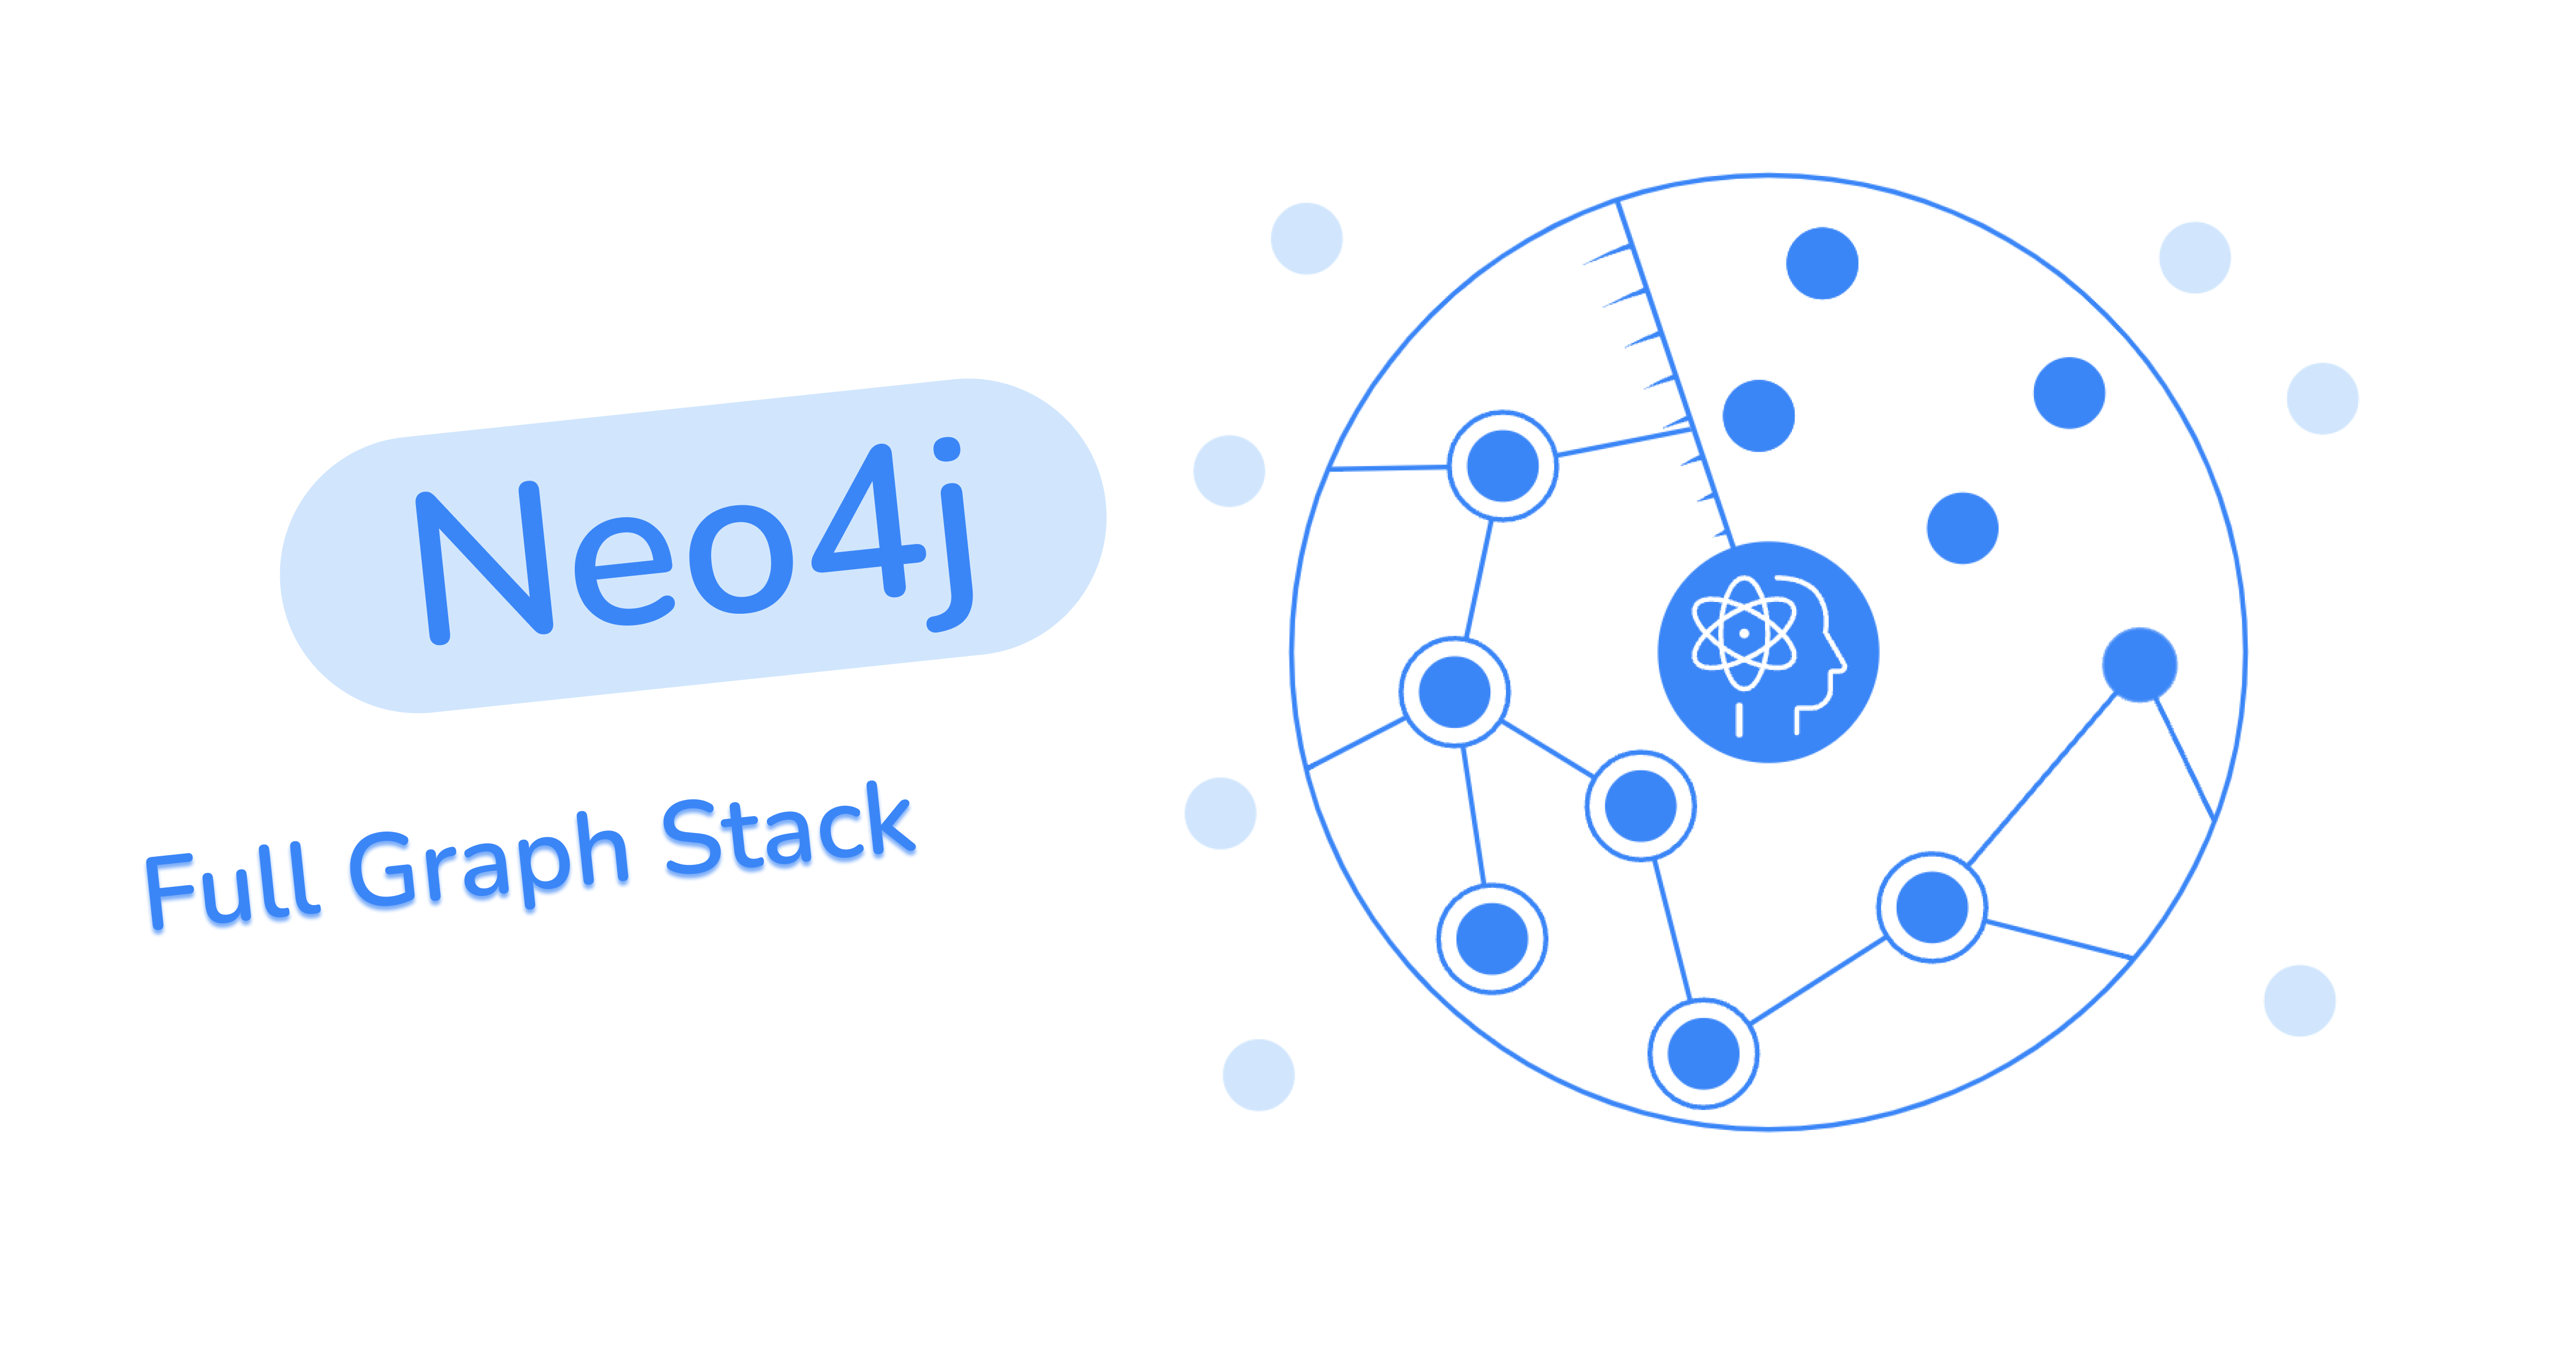
Graph bases like Neo4j are designed to handle large-scale datasets with millions or billions of nodes and relationships. They offer excellent scalability and performance, enabling efficient processing and analysis of massive interconnected data.
UST’s innovative approach:
At our company, we utilize neo4j, a leading graph database platform, to leverage the power of graph-based data structures and unlock valuable insights from interconnected data. neo4j has emerged as a key component of our data infrastructure, enabling us to harness the full potential of graph technology and drive innovative solutions across various domains.
Within our company, Neo4j is pivotal in addressing one of the key challenges in tax analysis: identifying tax gaps. By harnessing the advanced capabilities of Neo4j’s graph databases, we have transformed our approach to detecting and analyzing tax discrepancies with exceptional efficiency and accuracy.
Neo4j’s graph databases provide a powerful framework for constructing and analyzing complex networks of tax-related data. The flexible data model and efficient graph traversal capabilities of Neo4j enable us to navigate through vast amounts ed information efficiently, identifying critical patterns, and uncovering hidden relationships. With Neo4j, we can seamlessly build extensive data chains, allowing us to detect tax gaps that might otherwise remain undetected using traditional approaches.
Applying Neo4j in our tax analysis endeavors has revolutionized our approach, enabling us to deliver superior client results. With Neo4j’s graph databases, we can efficiently analyze large volumes of tax data, identify inconsistencies, and streamline the process of detecting tax gaps. This transformative technology strengthens our ability to ensure compliance, enhance accuracy, and contribute to the integrity of tax systems.
We want to give examples of how our company uses graph bases in other niches
Recommendation Analysis
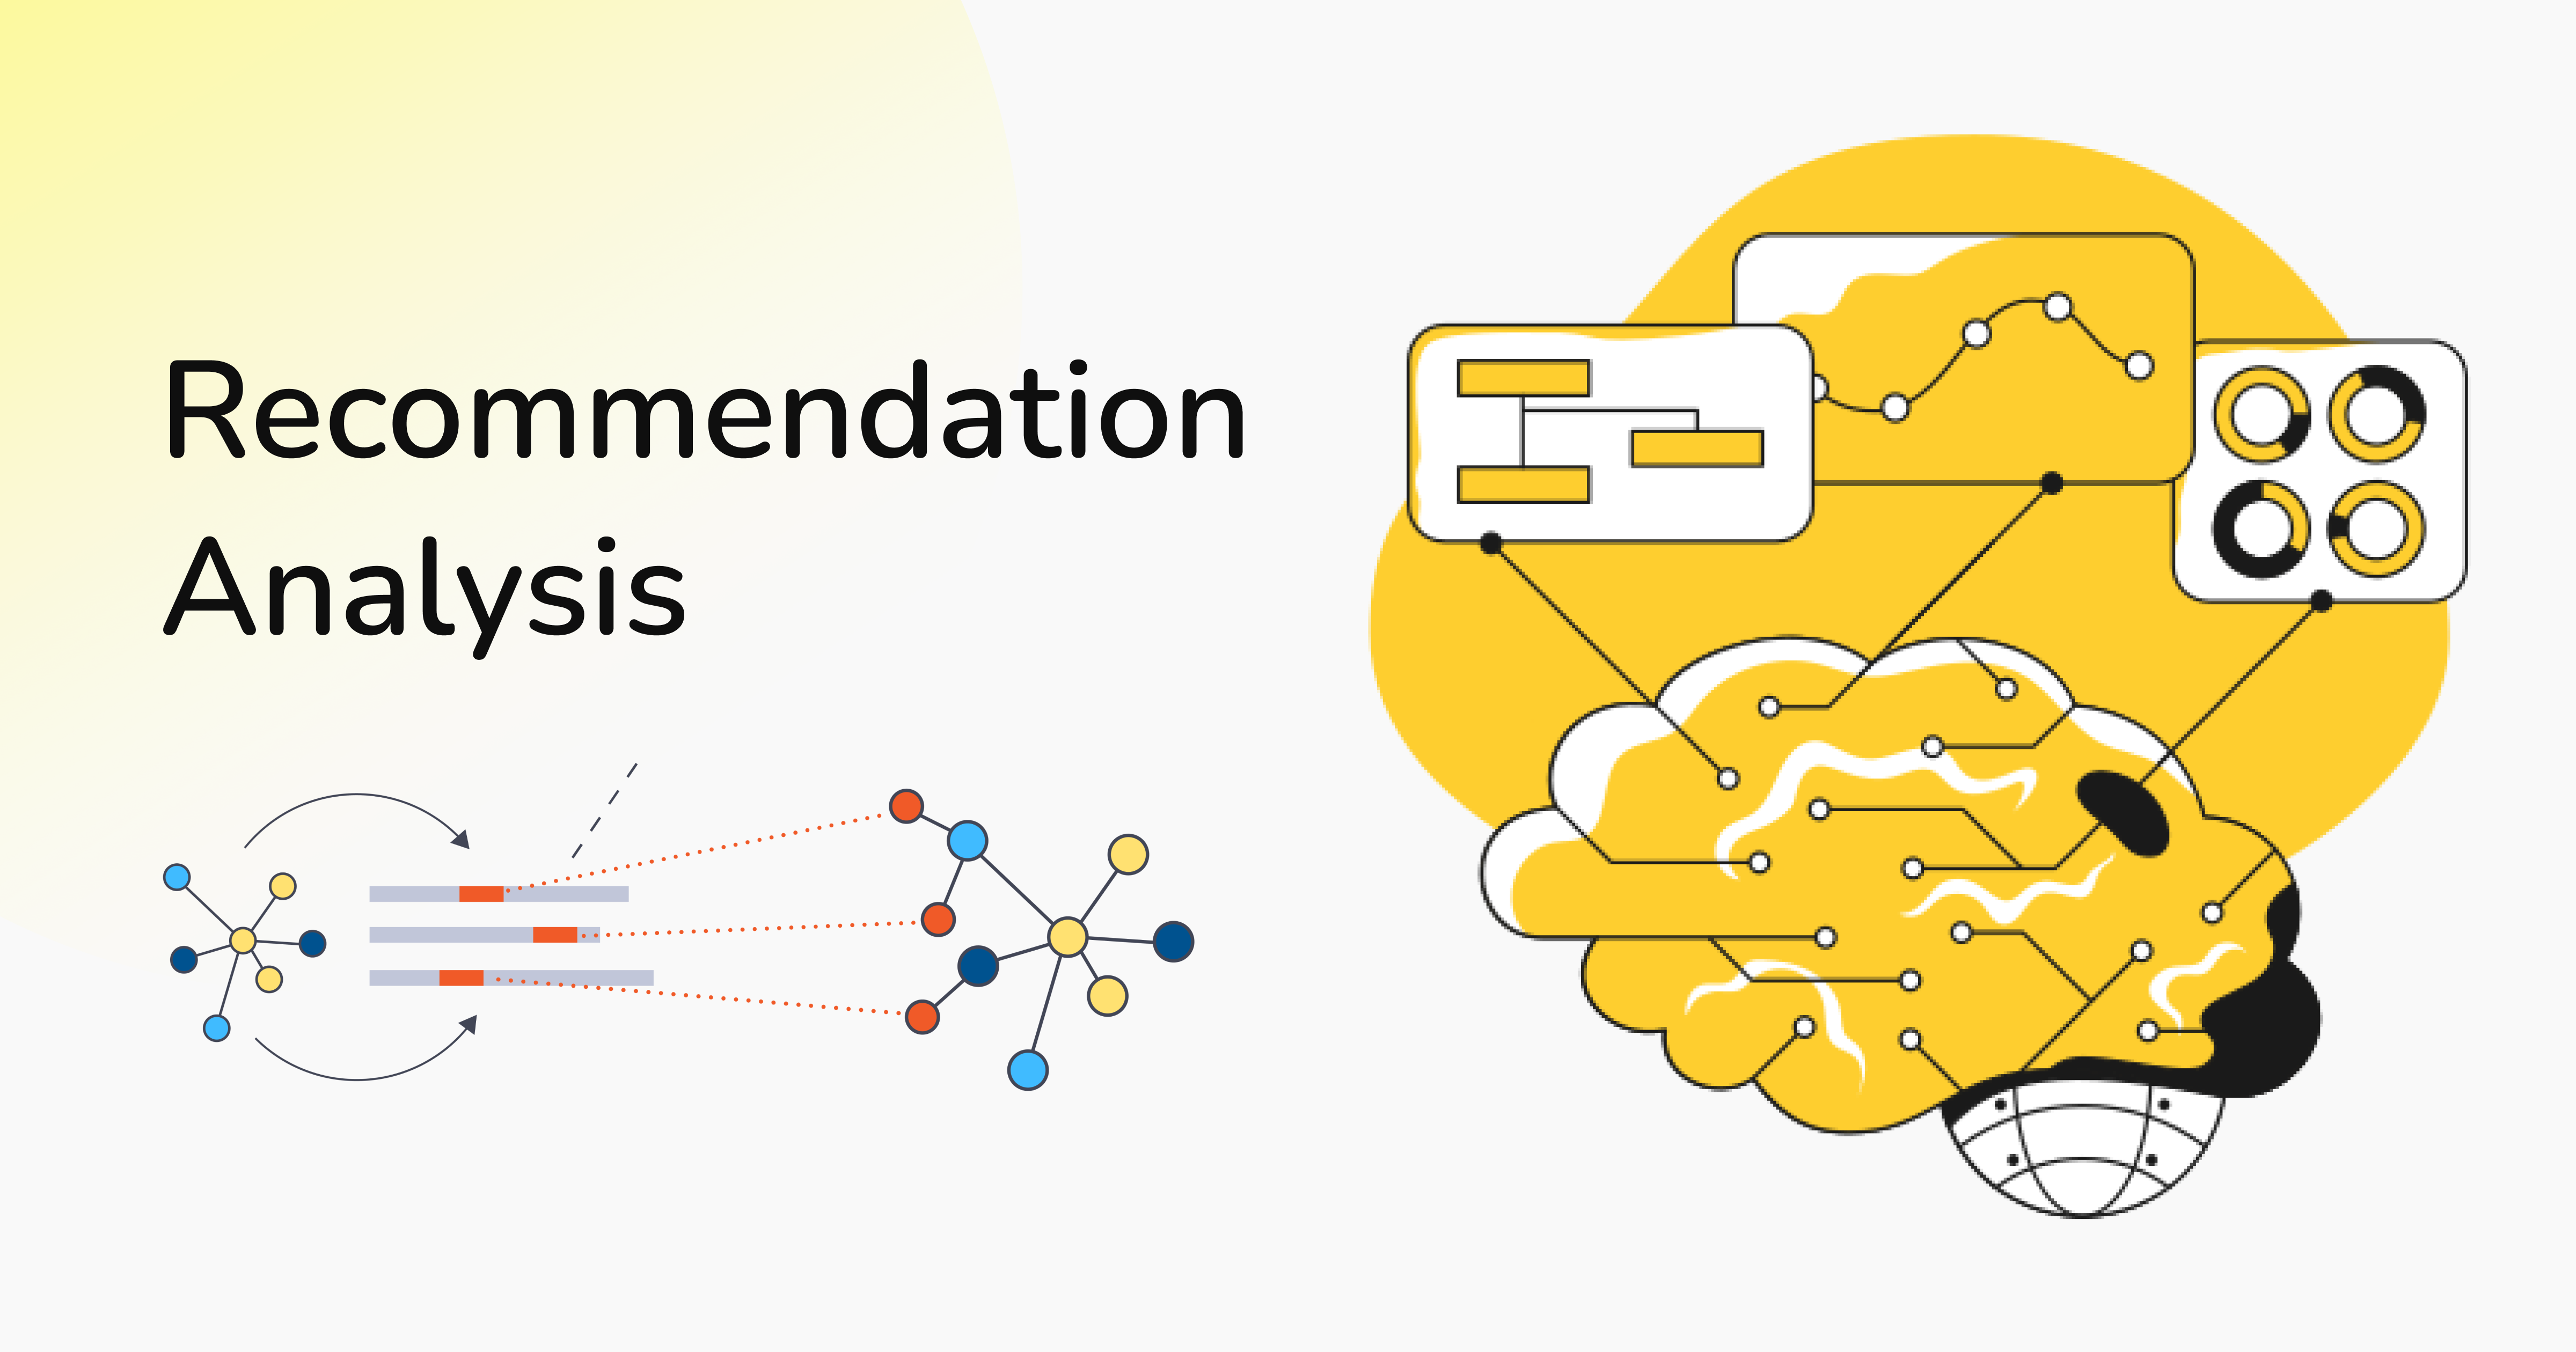
In our recommendation analysis, we harness the power of graph bases to provide personalized and accurate recommendations to our client’s customers. We create a comprehensive network that captures their relationships by representing users, products, and interactions as nodes and edges in a graph.
Recommendation analysis is a critical aspect of modern businesses. At our company, we leverage the power of graph bases to provide highly accurate and personalized recommendations to our client’s customers. By harnessing the capabilities of graph-based data structures, we have revolutionized our approach to recommendation analysis, delivering superior solutions that drive customer engagement and boost conversions. Let us explore how we use graph bases for recommendation analysis.
First, we construct a product graph that captures the relationships between users, products, and their interactions. In this graph, each product is represented as a node, and the connections between products are represented as edges. These edges can signify relationships such as co-purchasing, similarity, or user preferences.
By representing user behavior, such as purchases, ratings, and browsing history, as additional nodes in the graph, we create a rich network of interconnected data. The edges between users and products indicate their interactions, such as purchases, views, or reviews. This comprehensive representation enables us to uncover meaningful patterns and correlations within the data.
We leverage graph bases in recommendation analysis to provide accurate and personalized recommendations. Our product graph captures user-product relationships, representing them as nodes and edges. By analyzing these connections, we uncover patterns and deliver superior solutions that boost customer engagement and conversions. Through graph algorithms like collaborative filtering and personalized PageRank, we identify similarities, detect preferences, and deliver targeted recommendations, enhancing customer satisfaction and driving success.
Chain Finding
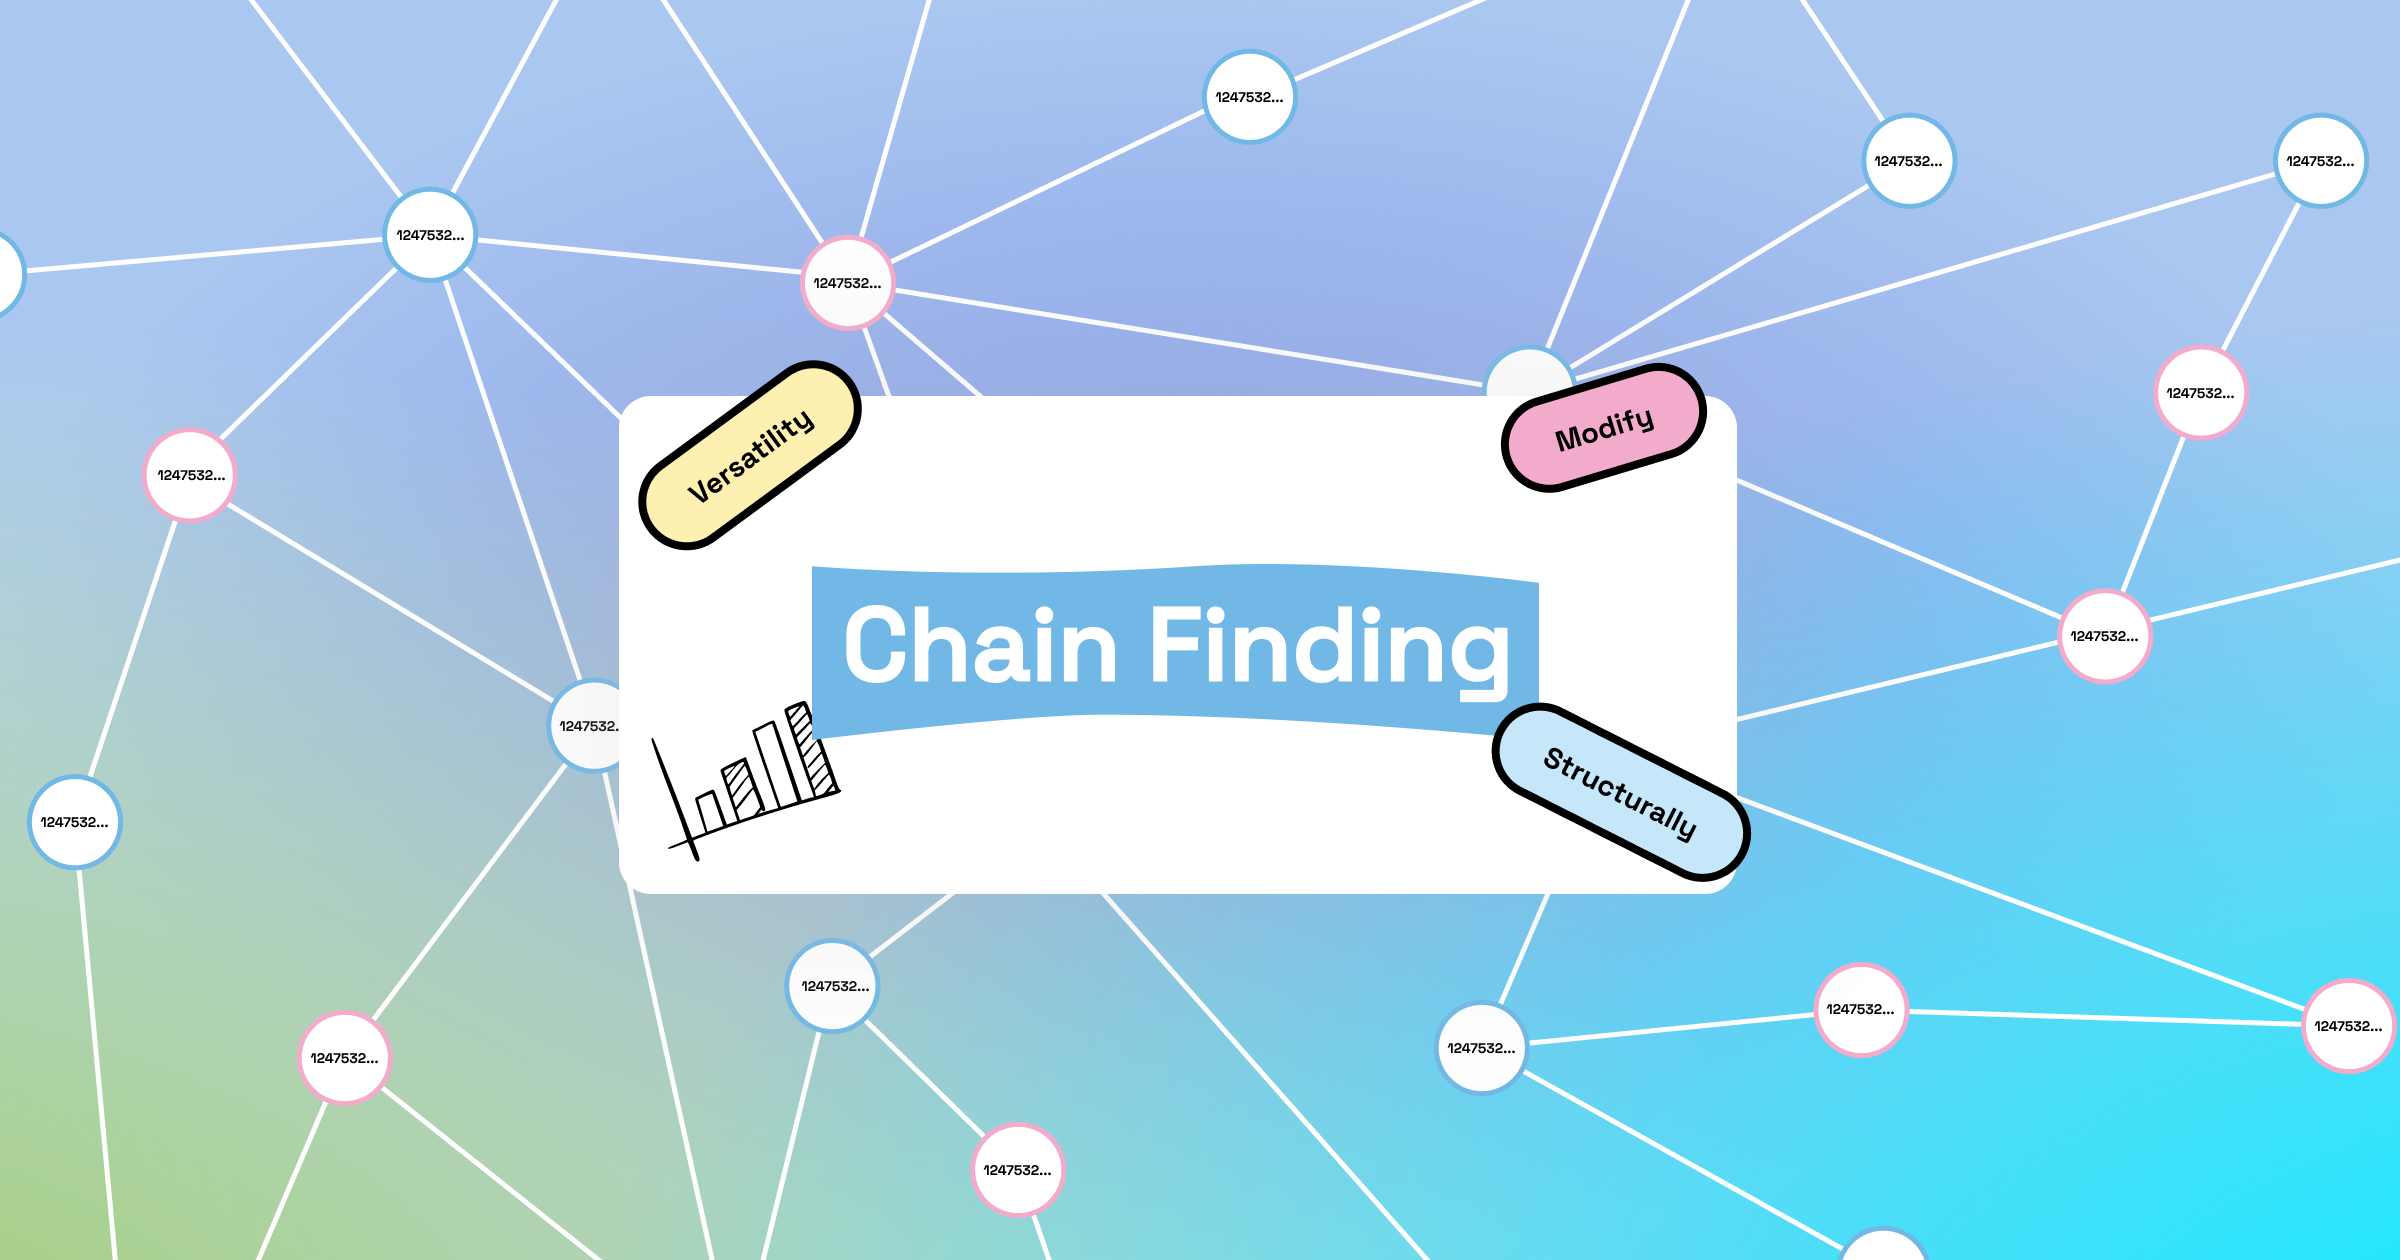
Regarding tax analysis, our approach involves constructing a tax graph representing various entities involved in the tax system, such as taxpayers, businesses, tax regulations, and financial transactions. Each entity is represented as a node in the graph, and their relationships are depicted as edges.
Let’s consider a scenario where tax authorities want to analyze the tax compliance of businesses in a specific industry.
We create a tax graph where nodes represent businesses, and the edges represent their financial transactions, partnerships, and other relevant connections. By incorporating tax regulations into the graph structure, we capture the rules and requirements governing tax obligations.
Once the tax graph is constructed, we apply graph algorithms and analysis techniques to identify potential gaps in tax compliance. We look for patterns that indicate potential tax breaks or discrepancies in reporting. This analysis can help tax authorities pinpoint businesses underreporting income, exploiting loopholes, or engaging in aggressive tax planning strategies.
Using graph bases in tax analysis allows us to provide tax authorities with a holistic and interconnected view of the tax ecosystem. By leveraging the power of relationships, we can identify gaps and potential areas of non-compliance and recommend strategies to ensure fair tax collection and prevent tax breaks.
In conclusion, a basic graph is a powerful tool for big-data analysis and understanding complex relationships in interrelated data. By representing entities as nodes and their relationships as edges, the basic graph allows us to uncover valuable insights, identify patterns, and make informed decisions. Whether it’s recommendation analysis, tax compliance, fraud detection, or other areas, the underlying graph allows us to harness relationships' power and unlock interconnected data's full potential. Its versatility and ability to reflect complex networks make it an indispensable asset in today’s data-driven world.
Our company is well-positioned to provide a comprehensive solution, leveraging Neo4j’s capabilities, expertise in graph-based data analysis, and a deep understanding of your needs. With our expertise and customized approach, we can harness the power of graph technology to create innovative solutions that provide personalized guidance, improve tax compliance and reveal valuable information from interconnected data.
Get in touch!
Email: contact@unionsmarttech.com

